해당 내용은 coursera Andrew Ng교수의 Machine Learning강의노트
Multiple Features
다변량 회귀는 변수가 여러 개인 선형회귀이다.
기존의 예시인 주택크기 이외에도 방의 수, 거실의 수, 주택연식등 다른 변수들이 추가되어 주택의 가격을 예측하고자 하는 예시를 생각해 보면
주택 크기에 따른 주택가격 예측하는 기존 예시: $h_{\theta}(x) = \theta_0 +\theta_1x$

다른 변수들도 고려 : $h_{\theta}(x)= \theta_0+\theta_1x_1+\theta_2x_2+\theta_3x_3+\theta_4x_4$

일반화를 시켜보면
$$ h_{\theta}(x)= \theta_0+\theta_1x_1+\theta_2x_2+...+\theta_nx_n \\x_0 = 1로 하면\\x=\begin {bmatrix} x_0\\x_1\\x_2\\..\\x_n\end {bmatrix}\in\mathbb {R}^{n+1} \qquad \theta=\begin {bmatrix}\theta_0\\\theta_1\\\theta_2\\..\\\theta_n\end {bmatrix}\in\mathbb {R}^{n+1}\\ =>\begin {bmatrix}\theta_0&\theta_1&\theta_2&..&\theta_n\end {bmatrix}\begin {bmatrix} x_0\\x_1\\x_2\\..\\x_n\end {bmatrix}\\=\theta^Tx $$
Gradient Descent
다변량에 대한 경사하강법은
$$ \theta_0 := \theta_0 -\alpha \frac {1}{m}\sum_{i=1}^{m}(h_{\theta}(x^{(i)})-y^{(i)})x_0^{(i)}\\\theta_1 := \theta_1 -\alpha \frac {1}{m}\sum_{i=1}^{m}(h_{\theta}(x^{(i)})-y^{(i)})x_1^{(i)}\\\theta_2 := \theta_2 -\alpha \frac {1}{m}\sum_{i=1}^{m}(h_{\theta}(x^{(i)})-y^{(i)})x_2^{(i)}...\\=>\theta_j := \theta_j -\alpha \frac {1}{m}\sum_{i=1}^{m}(h_{\theta}(x^{(i)})-y^{(i)})x_j^{(i)} \qquad for\quad j:=0,1,2... n $$
Feature Scaling
입력변수의 범위가 서로 너무 다른 경우 변수의 범위를 일정하게 해 주면 효율적으로 gradient descent를 할 수 있다. 즉, 입력변수의 차가 크게 되면 등고선 그래프가 길쭉한 모양을 띠게 되고 gradient descent step마다 좌우로 많이 이동하게 된다. 그러나 feature scaling을 통해 변수를 일정 범위로 동일하게 만들어 주게 되면 더 효율적으로 gradient descent update가 이루어지게 된다.

범위는 대략 $$-1 \le x_i \le 1 $$ 정도이나 반드시 $$-1 \le x_i \le 1 $$ 범위로 feature scaling을 해야 하는 것을 아니다.
$$ x_i :=\frac {x_i-\mu_i}{s_i} $$
$\mu_i$: feature i의 평균
$s_i$: 해당 입력값의 범위 (max-min) 또는 표준편차
Learning Rate
매 iteration마다 $J(\theta)$가 줄어들게 되면 경사하강이 잘 작동되고 있다고 할 수 있다.
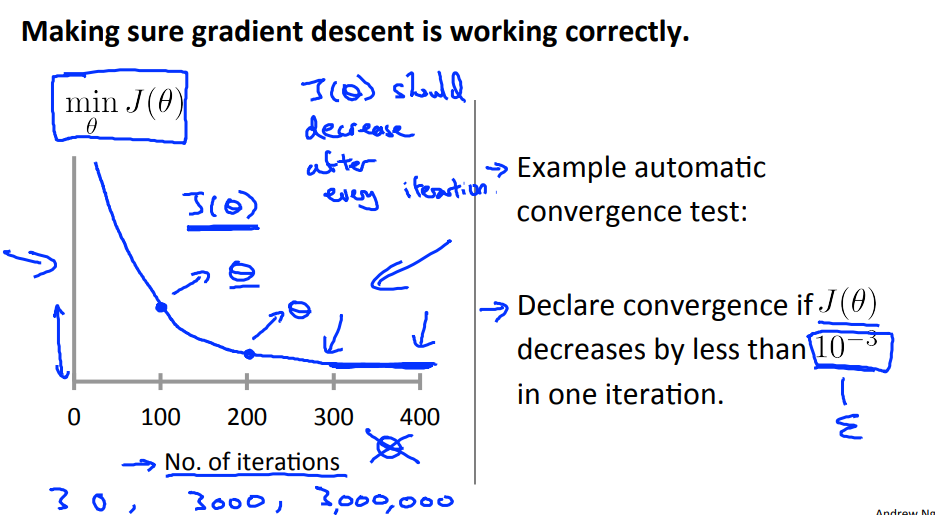
만일 $J(\theta)$가 iteration마다 감소하는 대신 증가하거나, 줄어들다가 증가하는 패턴을 보인다면 learning rate을 줄이도록 해야 한다. Learning rate이 큰 경우 gradient descent 과정에서 $J(\theta)$가 줄어들지 않아 수렴하지 않거나 또는 발산하게 된다.
반대로 learning rate $\alpha$가 너무 작으면 gradient descent가 수렴하는 데 오래 걸릴 수 있다.

Features and Polynomial Regression
선형의 hypothesis function이 데이터를 잘 표현하지 못하면 항이 제곱이나 3승 등으로 이루어진 다항식회귀분석을 할 수 있다.
주어진 주택가격 예에서는 식에서는 $h_{\theta}(x)=\theta_0+\theta_1x_1$으로 hypothesis hunction을 표현하였다면
2차 함수로 $h_{\theta}(x)=\theta_0+\theta_1x_1+\theta_1x_1^2$ 표현할 수 있는데 2차 함수는 포물선 모양으로 주택가격 함수에 적절하지 않다 → 일정가격 이상에서는 주택크기에 따라 가격이 증가하는 대신 줄어들 수 있다. 따라서 1 차수가 커진 3차 항으로 표현하면 $h_{\theta}(x)=\theta_0+\theta_1x_1+\theta_1x_1^2+\theta_1x_1^3$으로 만들 수 있다.
혹은 h_{\theta}(x)=\theta_0+\theta_1x_1+\theta_1\sqrt{(x_1)} 으로 표현 할수 있다.

feature의 차수가 증가하면 변수 값의 범위가 그에 따라 커지게 되므로 feature scaling이 더욱 중요해지게 된다.
$size :$ 1~1000
$(size)^2:$ 1~1000,000
$(size)^3:$ 1 ~ $10^9$
Refrenece
Machine learning , Coursera, Andrew Ng